

Long-form analysis / Scorers
How should we compare the Turkish league’s great scoring seasons?
Goal totals, scoring frequency, share of team goals and league position describe different achievements. Two maps and a common table broaden the comparison beyond Metin, Tanju, Hakan and Aykut.
Updated: 29 October 2026
One more goal, but under what conditions?
Was Tanju Çolak’s 39-goal season greater than Metin Oktay’s 38? The total invites a simple answer, but one played 37 league matches and the other 26. Hakan Şükür also scored 38 in 1996/97, from 33 appearances. Similar totals hide different schedules, team attacks and title races. We therefore compare four perspectives rather than force them into one ranking.
From the top-scorer archive we selected seasons with at least 30 goals or more than one per appearance. We added Aykut Kocaman’s 29-, 25- and 27-goal awards as useful comparisons outside those thresholds. This is an examination of consistently recorded scoring seasons, not an exhaustive career ranking of every player.
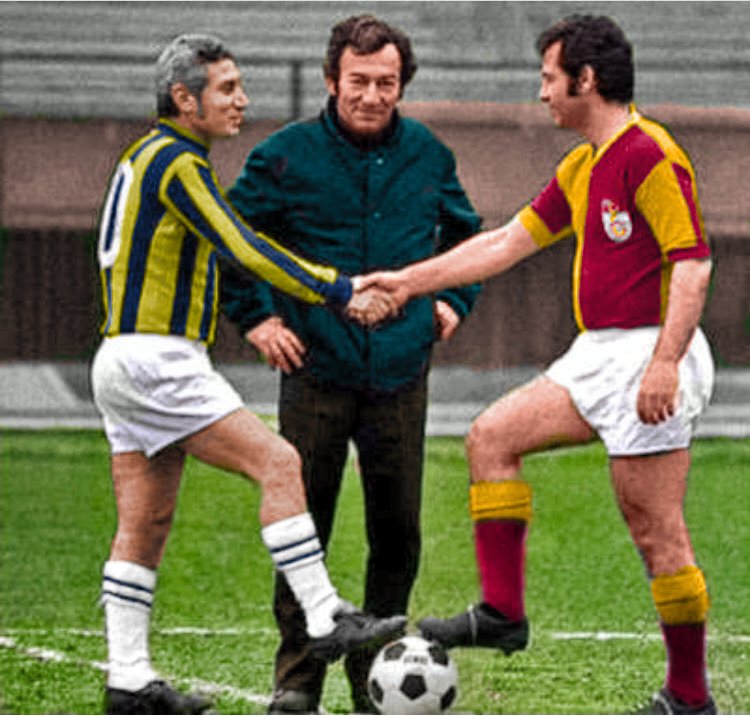
Photo information
Image record and usage information ↗Volume and frequency produce different leaders
In the first map, moving right means more goals per appearance and moving up means more goals in total. Tanju’s 1987/88 is highest at 39; Metin’s 1962/63 is farther right at 38 goals and 1.46 per game. Hakan’s 38 from 33 is about 1.15. Equal totals with Metin conceal different frequencies. Which season leads depends on the question.
Goals per appearance is not goals per 90 minutes: a substitute appearance and a full match each count once. Inconsistent historical minutes prevent that adjustment. The map distinguishes recorded scoring frequency, rather than proving which player was better.
Total goals
Goals / appearance →
Table values
| Player · season | Goals | Matches | Goals / match | Club · final position | Share of team goals |
|---|---|---|---|---|---|
| Metin Oktay · 1959/60 | 33 | 35 | 0.94 |  Galatasaray · 3 | 44.6% |
| Metin Oktay · 1960/61 | 36 | 28 | 1.29 | Galatasaray · 2 | 48% |
| Metin Oktay · 1962/63 | 38 | 26 | 1.46 | Galatasaray · 1 | 36.2% |
| Tanju Çolak · 1985/86 | 33 | 34 | 0.97 |  Samsunspor · 3 | 57.9% |
| Tanju Çolak · 1987/88 | 39 | 37 | 1.05 | Galatasaray · 1 | 45.3% |
| Aykut Kocaman · 1988/89 | 29 | 34 | 0.85 |  Fenerbahçe · 1 | 28.2% |
| Tanju Çolak · 1990/91 | 31 | 29 | 1.07 | Galatasaray · 2 | 49.2% |
| Aykut Kocaman · 1991/92 | 25 | 25 | 1 | Fenerbahçe · 2 | 30.9% |
| Tanju Çolak · 1992/93 | 27 | 23 | 1.17 | Fenerbahçe · 5 | 36% |
| Aykut Kocaman · 1994/95 | 27 | 25 | 1.08 | Fenerbahçe · 4 | 34.6% |
| Hakan Şükür · 1996/97 | 38 | 33 | 1.15 | Galatasaray · 1 | 42.2% |
| Serkan Aykut · 1999/00 | 30 | 33 | 0.91 | Samsunspor · 7 | 58.8% |
| Fatih Tekke · 2004/05 | 31 | 34 | 0.91 |  Trabzonspor · 2 | 42.5% |
| Burak Yılmaz · 2011/12 | 33 | 34 | 0.97 | Trabzonspor · 3 | 50.8% |
| Mbaye Diagne · 2018/19 | 30 | 29 | 1.03 |  Kasımpaşa · 14 / Galatasaray · 1 | Kasımpaşa: %37,7 / Galatasaray: 13.9% |
How much of the team’s scoring came from one player?
Hakan’s 38 represented 42.2% of Galatasaray’s 90 goals in 1996/97. Tanju’s 39 were 45.3% of the club’s 86 in 1987/88. Aykut’s 29 accounted for 28.2% of Fenerbahçe’s 103 in 1988/89. That does not make Aykut’s season less valuable: it shows that more of the team’s scoring came from other players.
The 1962/63 league had two phases. Using all 105 Galatasaray goals across both gives Metin a 36.2% share. Dividing his whole-season goals by only the final group’s team total would inflate the proportion. Similarly, Diagne’s 30 are not all assigned to Galatasaray: his 20 at Kasımpaşa and ten at Galatasaray have separate team shares.
A scoring title did not always bring a league title
The second map compares scoring frequency with final league position, with first place at the top. It separates the scorer’s achievement from the team’s finish. Fatih Tekke scored 31 as Trabzonspor finished second in 2004/05; Serkan Aykut’s 30 in 1999/00 came in a different campaign for Samsunspor. Those totals should not be judged under exactly the same expectations as the forwards of champions.
A high team share is not automatically positive. It may show a player carrying responsibility, or a team short of other scorers. Separating those explanations requires chance quality, penalties, assists and minutes, which are not consistently available across the period. We do not turn the association in the table directly into a cause.
League position · 1 at the top
Goals / appearance →
Choose the achievement before choosing the winner
There is a more useful result than declaring one winner. For sheer volume, Tanju’s 39 stands out. For frequency over fewer appearances, Metin’s 38 from 26 describes a different achievement. Team share reveals how much of the scoring load a player carried, while league position shows the collective outcome.
Adding Hakan, Aykut, Fatih and the other seasons makes the comparison more interesting because one number no longer conceals every difference. We cannot fully separate a striker’s work from the team around him, but we can show concretely why equal totals do not mean equivalent seasons.