

Long-form analysis / Goal analysis
Why was 2000–01 the highest-scoring season?
Two 306-game seasons, six years apart, differed by 281 goals. Common clubs, relegated sides and European results help examine why.
Updated: 29 October 2026
How did the league lose so many goals?
The league produced 1,017 goals in 2000–01 and 736 in 2006/07. Both had 18 teams and 306 fixtures, so a changing schedule cannot explain almost one missing goal per match. Did teams become more defensive, did finishing quality fall, or had some early-season opponents simply conceded unusually easily?
The selection is deliberate: these were the highest and lowest totals in the 17 seasons of the same 18-team, 306-match format from 1994/95 to 2010/11. We are comparing the ends of one competition structure, not arbitrary years or claiming 2006/07 was the least prolific season in all league history.
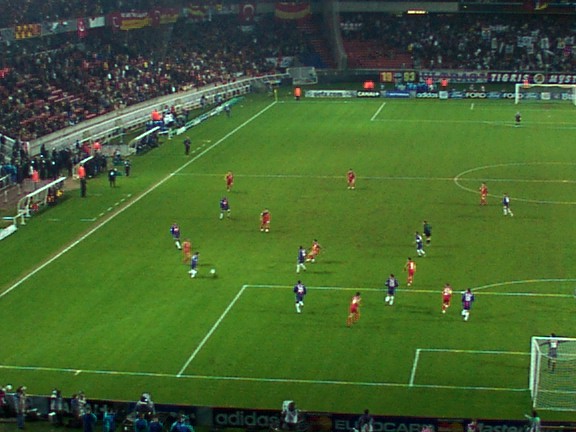
Photo information
Image record and usage information ↗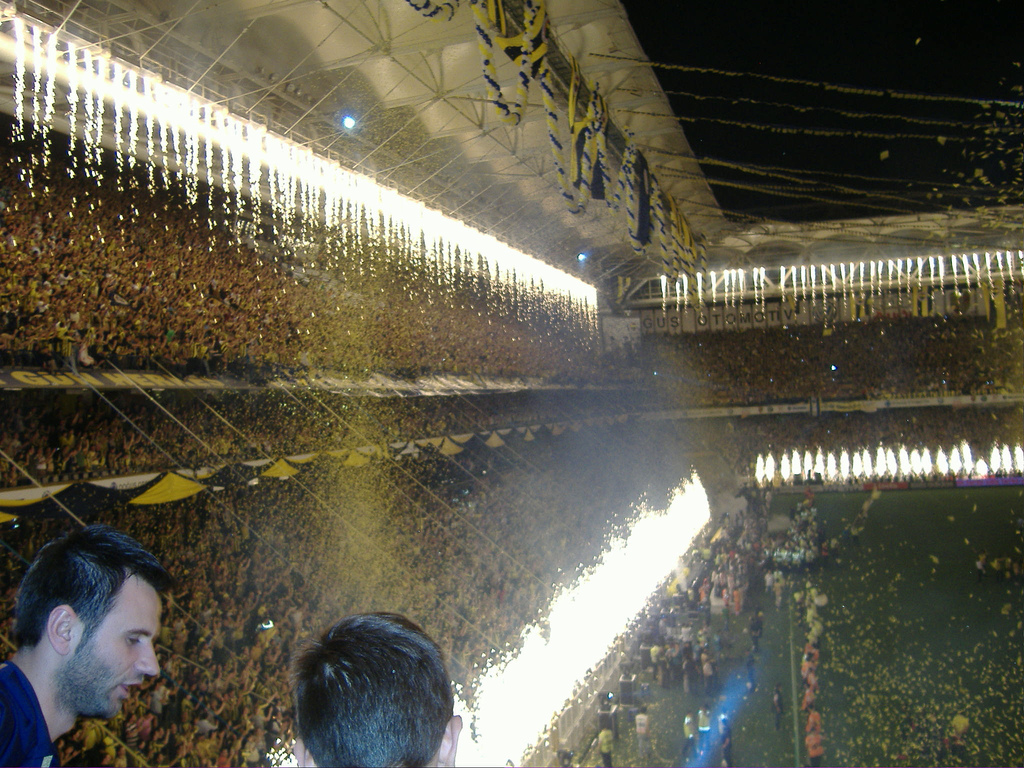
Can promoted clubs explain the difference?
We first isolated the 11 clubs present in both seasons. Goals in their 110 mutual fixtures fell from 354 to 260. Even keeping opponent identities the same left 94 missing goals, and every one of those clubs scored fewer in the later season. Fenerbahçe went from 82 to 65, Galatasaray from 77 to 58, Beşiktaş from 68 to 43 and Trabzonspor from 69 to 54.
The decline extended beyond the major clubs: Gaziantepspor fell from 67 to 31 and Ankaragücü from 65 to 32. Club identity does not hold squads or coaches constant across six years, but the check weakens an explanation based entirely on promoted and relegated teams. The change was widespread.
Clubs present in both seasons. Squads and coaches changed; goal differences are not causal estimates.
Table values
| Measure | 2000/01 | 2006/07 |
|---|---|---|
| Why these seasons were selected | Highest-scoring season in 1994/95–2010/11 | Lowest-scoring season in the same period |
| League format | 18 clubs · 306 fixtures | 18 clubs · 306 fixtures |
| Official goal total | 1,017 | 736 |
| Fixtures between the 11 common clubs | 110 fixtures · 354 goals | 110 fixtures · 260 goals |
| Penalty goals · full season | No verified comparable breakdown | 49 |
| Classified goals | No comparable breakdown | 734 · excluding 2 awarded goals |
| European games · W/D/L | 34 · 15/7/12 | 38 · 14/13/11 |
| European goals / game | 48 / 34 = 1,41 | 66 / 38 = 1,74 |
| Single-season UEFA coefficient | 7.750 | 6.100 |
| Deepest European run | Galatasaray · Champions League quarter-finals | Fenerbahçe · UEFA Cup round of 32 |
The lower end changed substantially
Adanaspor, Erzurumspor and Siirtspor, relegated in 2000/01, conceded 252 goals between them. Antalyaspor, Kayseri Erciyesspor and Sakaryaspor conceded 136 in 2006/07. Antalyaspor went down with 39 points and only 36 conceded, unlike early-period lower sides conceding 80–90. More resistant opposition plausibly reduced large scorelines.
Those 116 goals cannot be booked as an independently explained share of the decline. We selected clubs by eventual relegation, and concessions also depend on opposing attacks. Their scale nevertheless shows why looking only at famous scorers would leave the explanation incomplete.
Stars remained, but the results differed
Galatasaray added Jardel to the UEFA Cup-winning core in 2000/01, with his two goals winning the Super Cup. Following Hakan Şükür’s departure, Hagi and Jardel shared the attack. That was a strong squad, but six years later Fenerbahçe still had Alex, Tuncay, Appiah and Kežman. Quality attackers had not simply disappeared from the league.
Contemporary reports criticised the play of Tigana’s and Gerets’s sides, while Zico defended attacking football after the 3–3 with AZ. One uniform defensive preference is too simple an explanation. Squad fit, coaching and finishing may all have contributed, without compatible historical shots and xG to separate their effects.
What does Europe tell us?
Galatasaray won the Super Cup against Real Madrid and reached the Champions League quarter-finals in the first season. In 2006/07 Galatasaray exited in the group stage and Fenerbahçe reached the UEFA Cup round of 32. The annual country contribution was 7.750 against 6.100. The more prolific league season also had the stronger European peak, consistent with a contribution from strong attacking squads.
Across all European matches, including qualifying and Intertoto but excluding the one-off Super Cup, the first season produced 48 goals in 34 games and the second 66 in 38: 1.41 and 1.74 per match. The earlier win rate was higher, but European scoring did not decline. A simple claim that lower player quality reduced goals everywhere therefore meets counterevidence.
Could penalties be the explanation?
The TFF’s 2006/07 breakdown gives 501 footed goals, 172 headers, 49 penalties and 12 own goals. The gap from 734 to the official 736 is the two goals in the awarded Manisaspor–Sakaryaspor result. The 49 counts converted penalties, not every penalty awarded. Without a compatible 2000/01 breakdown, penalty decisions cannot explain the difference.
The most plausible answer has several parts
The 1,017-goal season was followed by 910; the other end moved from 849 down to 736 and back to 786. These look like unusual endpoints rather than uninterrupted decline. Strong early attacks meeting vulnerable opponents, followed by lower output among common clubs and more resistant lower sides, form a plausible combined explanation.
European achievements support the quality of the earlier peak squads, but European goal totals resist a quality-only decline story. Neither penalties alone nor missing stars explains 281 goals. Changing attacking output alongside changing opponent resistance is more persuasive. We cannot assign a precise goal count to each cause, but the investigation points to combined football conditions rather than one dominant explanation.